Traces
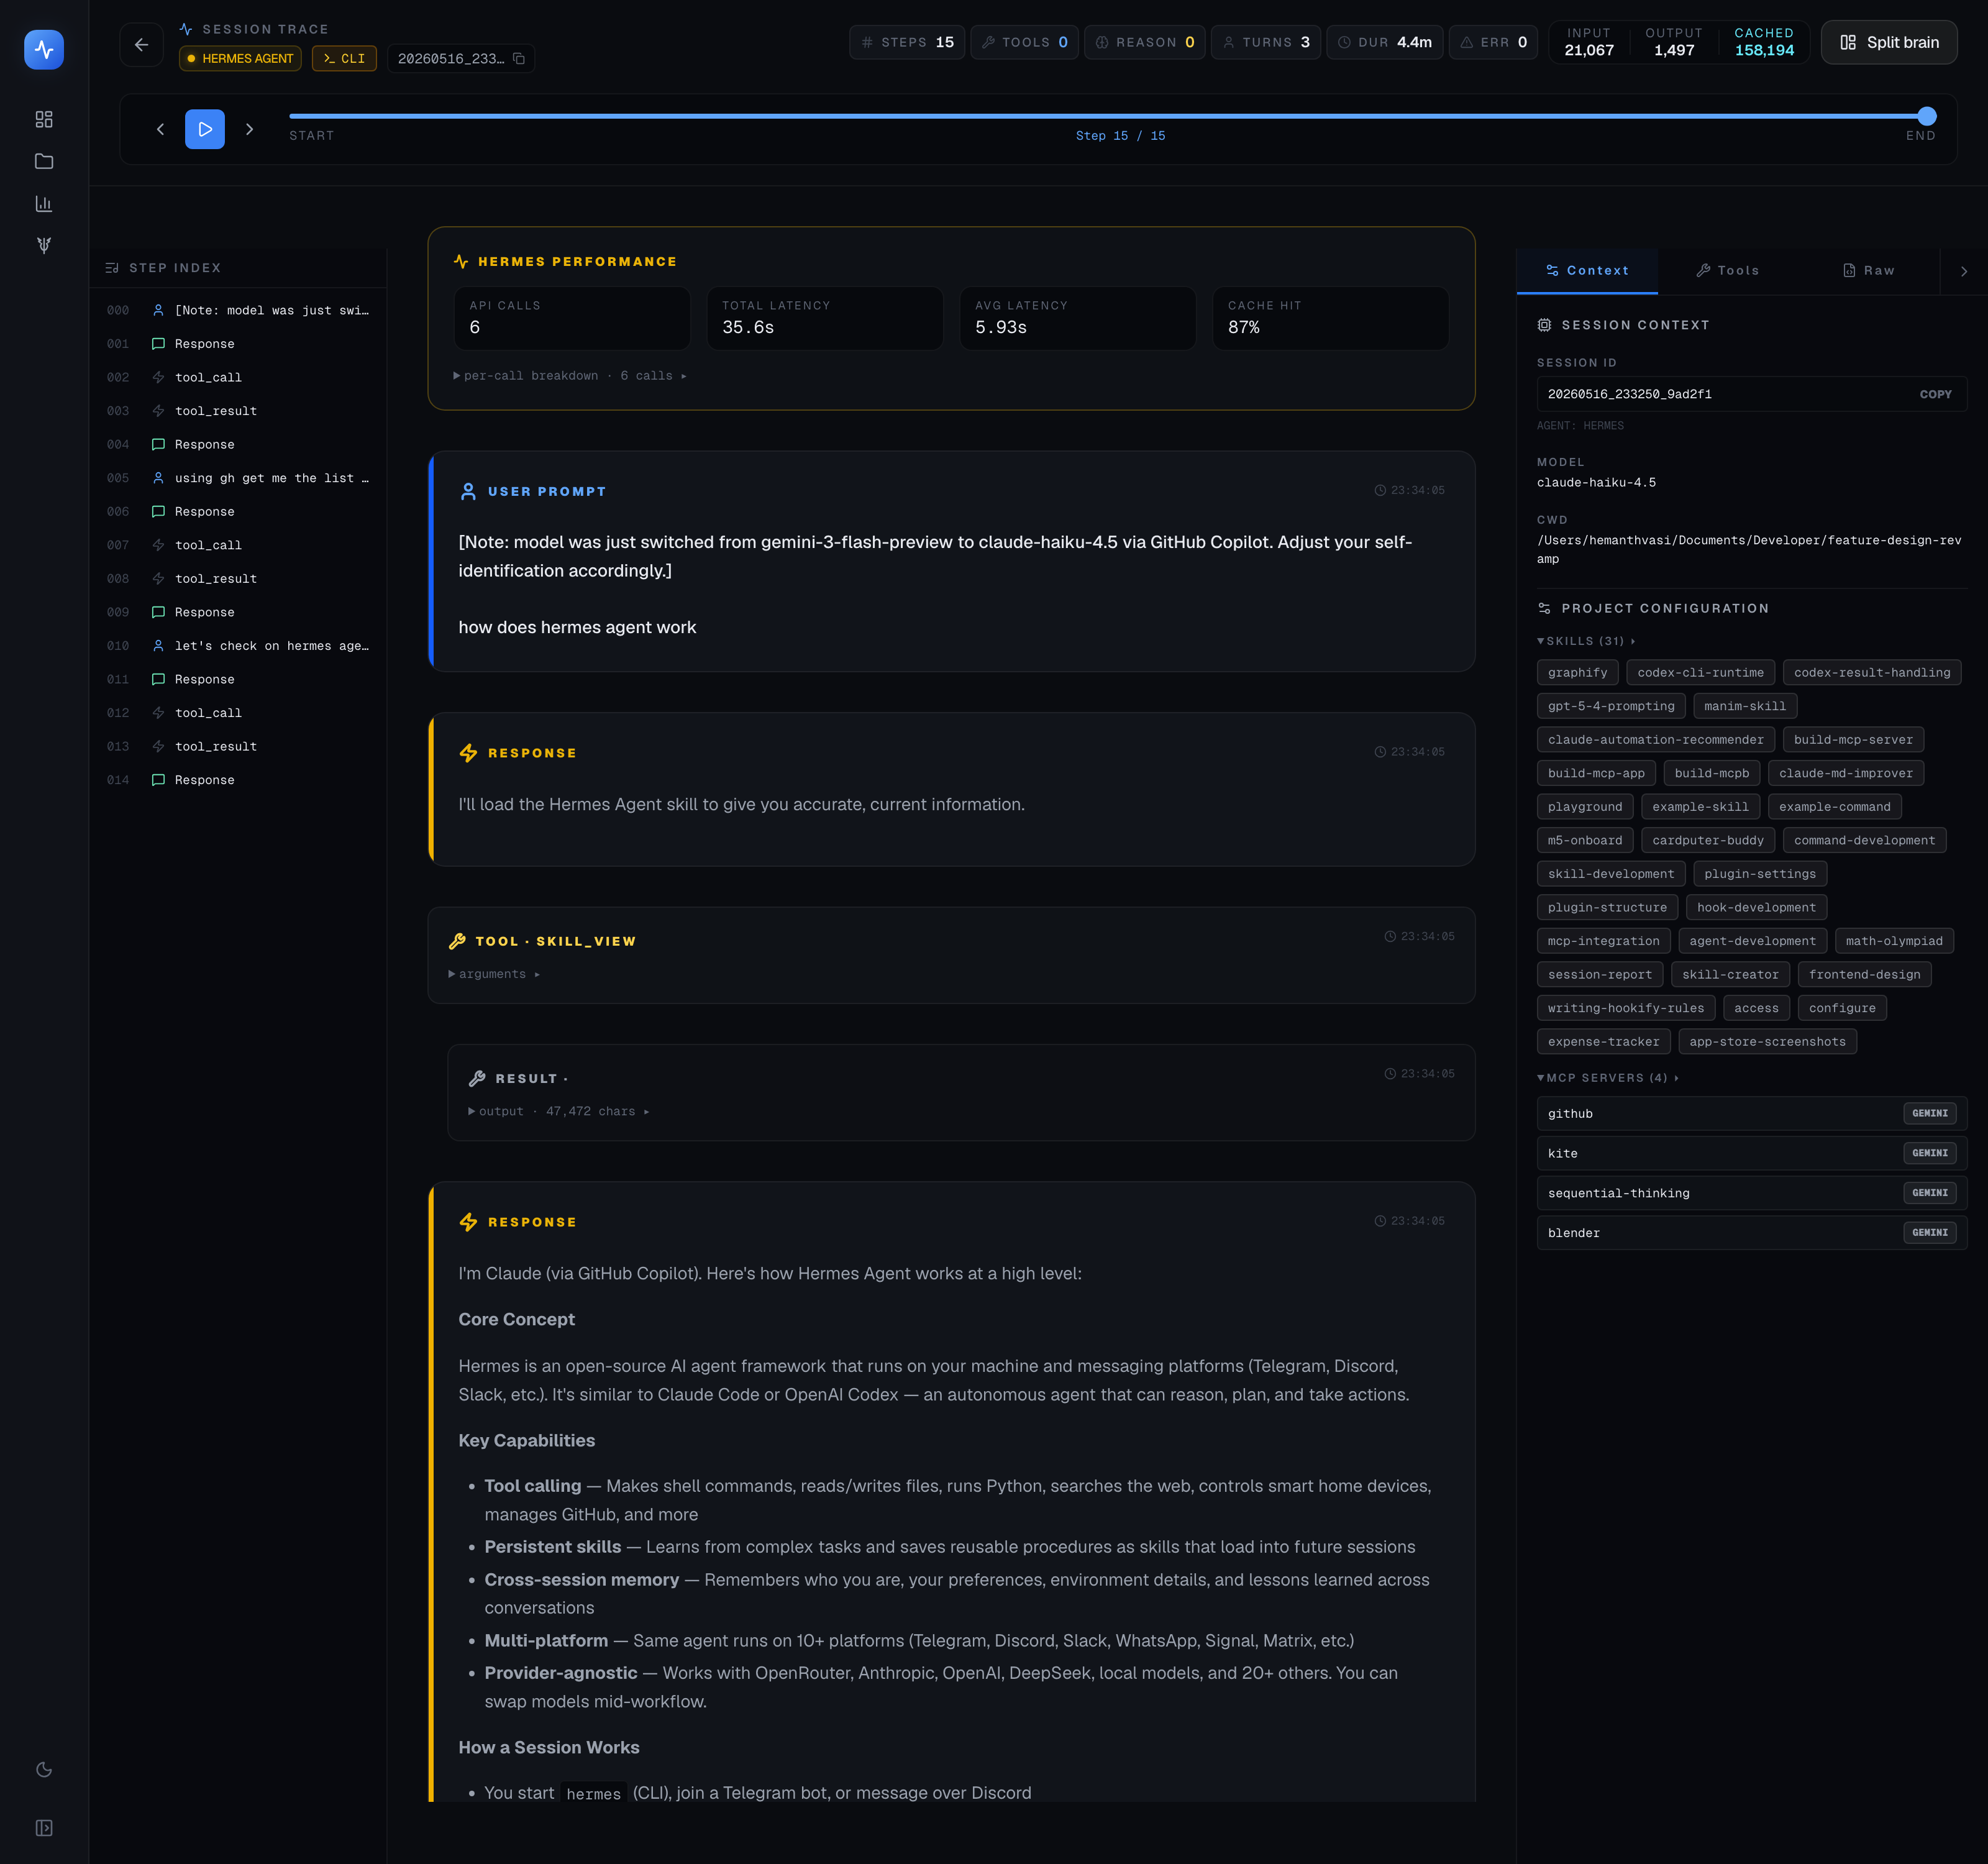
Replay every session step by step — events, messages, tool calls, artifacts, and plans, with kind-aware highlighting and honest reasoning labels.
A trace is a replayable record of a single agent session. Open any session from the Dashboard's recent activity feed, from the Analytics table, or from Projects → Activity to see its full trace.
Video walkthrough
Token and cost header
At the top of every trace is a summary header showing:
- Input tokens — tokens the agent sent to the model
- Output tokens — tokens the model returned
- Cache tokens — input tokens served from the model's prompt cache (where available)
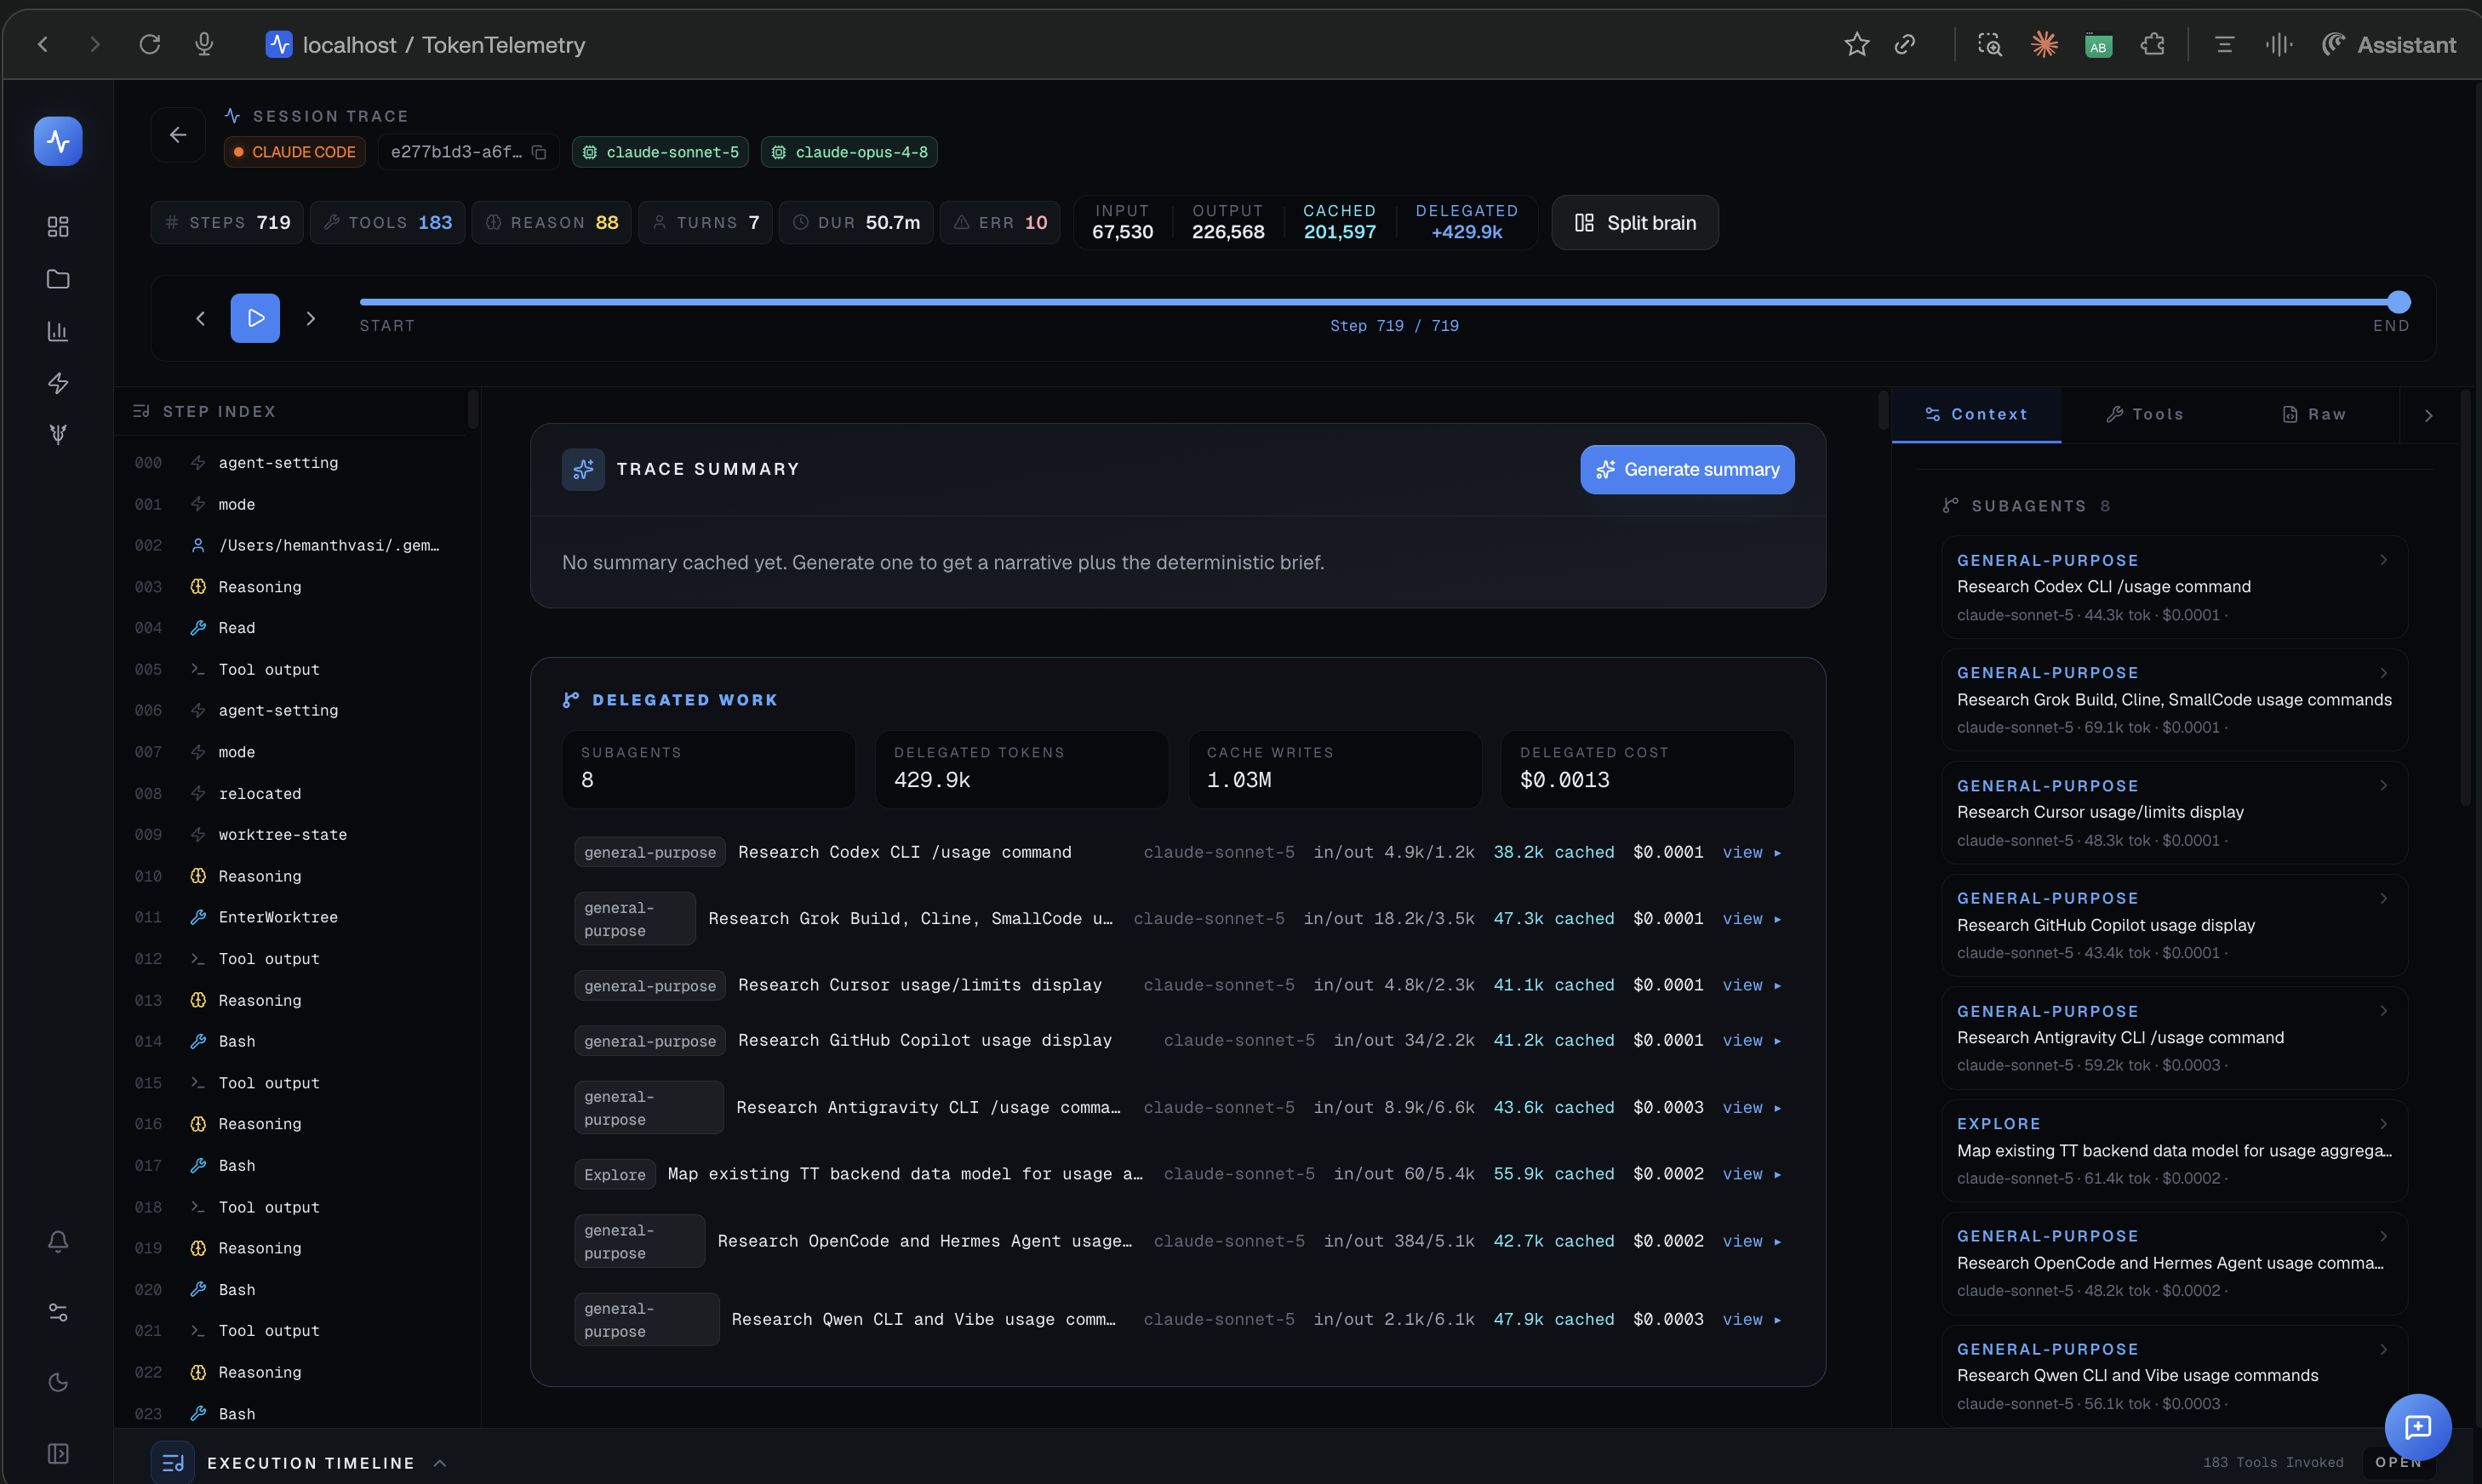
- Delegated — extra tokens spent inside sub-agents this session spawned, shown as
+Nand kept separate from the parent's own tokens. Only appears when the session delegated work — see Delegation & sub-agents below. - Cost — the API-equivalent cost for this session
- Model — the model that handled the session
- Duration — wall-clock time from session start to end
A row of stat pills sits beside the token header — Steps, Tools, Reason (reasoning blocks), Turns, Dur, and Err (errors) — so you can size up a session before scrubbing through it. These numbers come directly from the session log — no estimation.
Five tabs
Events
A timeline of every event in the session in chronological order: the session start, each assistant turn, each tool call and its result, and the session end. Events are color-coded by kind:
- Amber — reasoning / thinking blocks
- Sky blue — tool calls and results
- Emerald — assistant responses
- Default — user turns and system events
Use the Events tab to get an at-a-glance feel for the session structure: how many tool calls, how much reasoning, how much direct output.
Messages
The Messages tab shows the full conversation: user messages, system prompts, and assistant responses in order. This is the raw conversation as the model saw it.
Tools
A focused view of every tool call, grouped by tool name. Each entry shows:
- The tool name (e.g.
Bash,Edit,Read,WebSearch) - The arguments passed
- The result returned
- Timing (time from session start, and duration of the tool call)
- Success or failure
The Tools tab is useful when you want to audit what your agent actually ran — especially for Bash commands, where seeing the exact command and its output is more useful than reading the conversation.
Artifacts
The Artifacts tab shows what the agent created or captured during the session:
- Published pages — hosted artifact pages Claude Code published, linked externally
- Screenshots (from Antigravity or browser automation)
- Browser recording thumbnail strips
- Documents:
task.md,plan.md,walkthrough.md, and similar
See Artifacts for more detail on what's captured.
Plans
The Plans tab shows any plan-mode output captured during this session. For Claude Code, this includes the structured plan the agent produced after a /plan command. Plans are shown as formatted text with their timestamp.
Step navigation
The Events tab has a step navigator — forward/back arrows — so you can walk through the session event by event, as if scrubbing through a recording.
Kind-aware highlighting
Each event type has a distinct visual style so the trace is scannable at a glance:
| Kind | Color | Meaning |
|---|---|---|
| Reasoning | Amber | The model's internal thinking |
| Tool call | Sky blue | An action the agent took |
| Tool result | Sky blue (lighter) | What the tool returned |
| Response | Emerald | The model's output to the user |
| User | Default | What you (or the harness) sent |
Honest labelling of encrypted reasoning
Claude's extended thinking feature can produce encrypted reasoning blocks — thinking tokens that Anthropic encrypts before including in the session log. TokenTelemetry labels these blocks honestly: "Extended thinking (encrypted — content not available)." It never fabricates or infers reasoning content.
Split-brain view
The Split brain toggle in the header splits the trace into two synchronized columns: User & Agent Dialogue on the left (the conversation as it happened) and Internal Reasoning & Tools on the right (the model's thinking and the tool calls it made alongside it). It separates what the agent said from what it was doing and thinking while it said it. Toggle back to Unified view for the single-stream timeline.
Delegation & sub-agents
Many agents farm work out to sub-agents — Claude Code's Task tool, Hermes' delegate_task, DeepSeek Harness' subagent and subagent_fork, and similar. When a session spawns sub-agents, the trace attributes their token spend and cost back to the parent and lets you drill into each child's own trace. Qoder is the exception to the "token spend" part: its children's work is real but denominated in credits, so the delegation block says tokens not recorded by qoder and shows the delegated credits instead.
Delegated token stat
When a session delegated work, the token header gains a Delegated figure (e.g. +429.9k) alongside Input / Output / Cached. This is the token spend that happened inside sub-agents, kept separate from the parent's own tokens so you can see at a glance how much of the session's real cost was farmed out.
Delegated work card
The Delegated work card lists every sub-agent the session spawned. Summary tiles across the top show the sub-agent count, total delegated tokens, cache writes, and delegated cost; each row then breaks down one sub-agent: its type (e.g. general-purpose, Explore), the task it was given, the model it ran on, its input/output and cached tokens, and its cost. Click view on any row to open that sub-agent's full trace.
Sub-agents inspector
The right-hand inspector's Context tab carries a Sub-agents list — the same children in an at-a-glance sidebar. Click one to open its trace in a slide-over without leaving the parent session.
Parent session link
The link works the other way too. Open a sub-agent session on its own and a parent session link appears in its header; clicking it opens the parent trace. Between the two you can walk the full delegation chain from any point — down from a parent into the sub-agents it spawned, or up from a child to the session that spawned it.
DeepSeek Harness sessions
DeepSeek Harness resolves its skills, tools, and providers at run time, so the inspector's Context tab reads a Runtime Capabilities panel back from that session's own log instead of scanning what is installed now. Two sessions in the same folder can legitimately differ: a cordis-preset session loaded 8 skills and 32 tools where standard-preset sessions alongside it loaded 6 and 25. The panel lists Skills Loaded and Tools Available as they were resolved for that run, the Agent Preset it ran under, and the Providers the session routed to. A single DSH session can span several providers and models.
Below that sit File Sandbox and Approval Policy: the sandbox mode (for example workspace-write) and the approval policy (for example ask). A delegated sub-agent inherits both from its parent and can end up more permissive than it, so an inherited value is marked as inherited on the child.
The latency rows report LLM Time and Tool Time separately, alongside TTFT (avg), Throughput in tok/s, and Cache Hit. These match the figures DSH prints in its own UI footer.
Qoder sessions
A Qoder trace header reads CREDITS where other agents read input/output/cached, plus DELEGATED when sub-agents did part of the work, and TOKENS: not recorded. Qoder writes a usage block with every token counter at zero and bills in credits, so the zeros are what Qoder reports rather than a failed scan. See Billing modes for why they cannot be reconstructed.
Like DeepSeek Harness, Qoder resolves its capabilities at run time, so the Context tab shows a Runtime Capabilities panel read from that session's own log — the skills and MCP servers that run was offered, not a scan of what is installed now. Entries provided by a plugin keep their prefix and are tinted (better-harness:better-harness, qoder-qmind:qmind), so a harness-provided capability is distinguishable from a user-level skill.
Model names stay internal (qmodel_38max, qfmodel). Qoder's model catalogue is encrypted at rest, so there is no offline mapping to a real model, and the agent page lists that as unavailable with the reason rather than guessing.
Tips
- The Tools tab is the fastest way to see if an agent ran a command you didn't expect — especially useful after a long autonomous session.
- If reasoning blocks look empty, the session used encrypted extended thinking. This is intentional — see the "Honest labelling" note above.
- Use the parent-session link to trace a cost spike back to the root cause: find the expensive sub-agent session, then follow the link up to the parent that spawned it.