See what your AI coding agents cost, think, and do — 100% on your machine.
Read-only observability for Claude Code, Codex, Cursor, Gemini CLI & 9 more. It reads the logs your agents already write — no SDK, no signup, and your data never leaves your computer.
$curl -fsSL https://raw.githubusercontent.com/VasiHemanth/tokentelemetry/main/install.sh | bashMIT · runs offline · needs Node 18+, Python 3.9+
From zero to dashboard in one command
No instrumentation. No code changes.
Your agents already write logs. TokenTelemetry just reads them — so setup is one line, and there's nothing to wire into your codebase.
Run one command
Paste it into your terminal. Installs in seconds, opens automatically — no account, no API keys.
It finds your agents
Scans the log files Claude Code, Codex, Cursor & co. already write to your disk. Read-only. Nothing is sent anywhere.
Open the dashboard
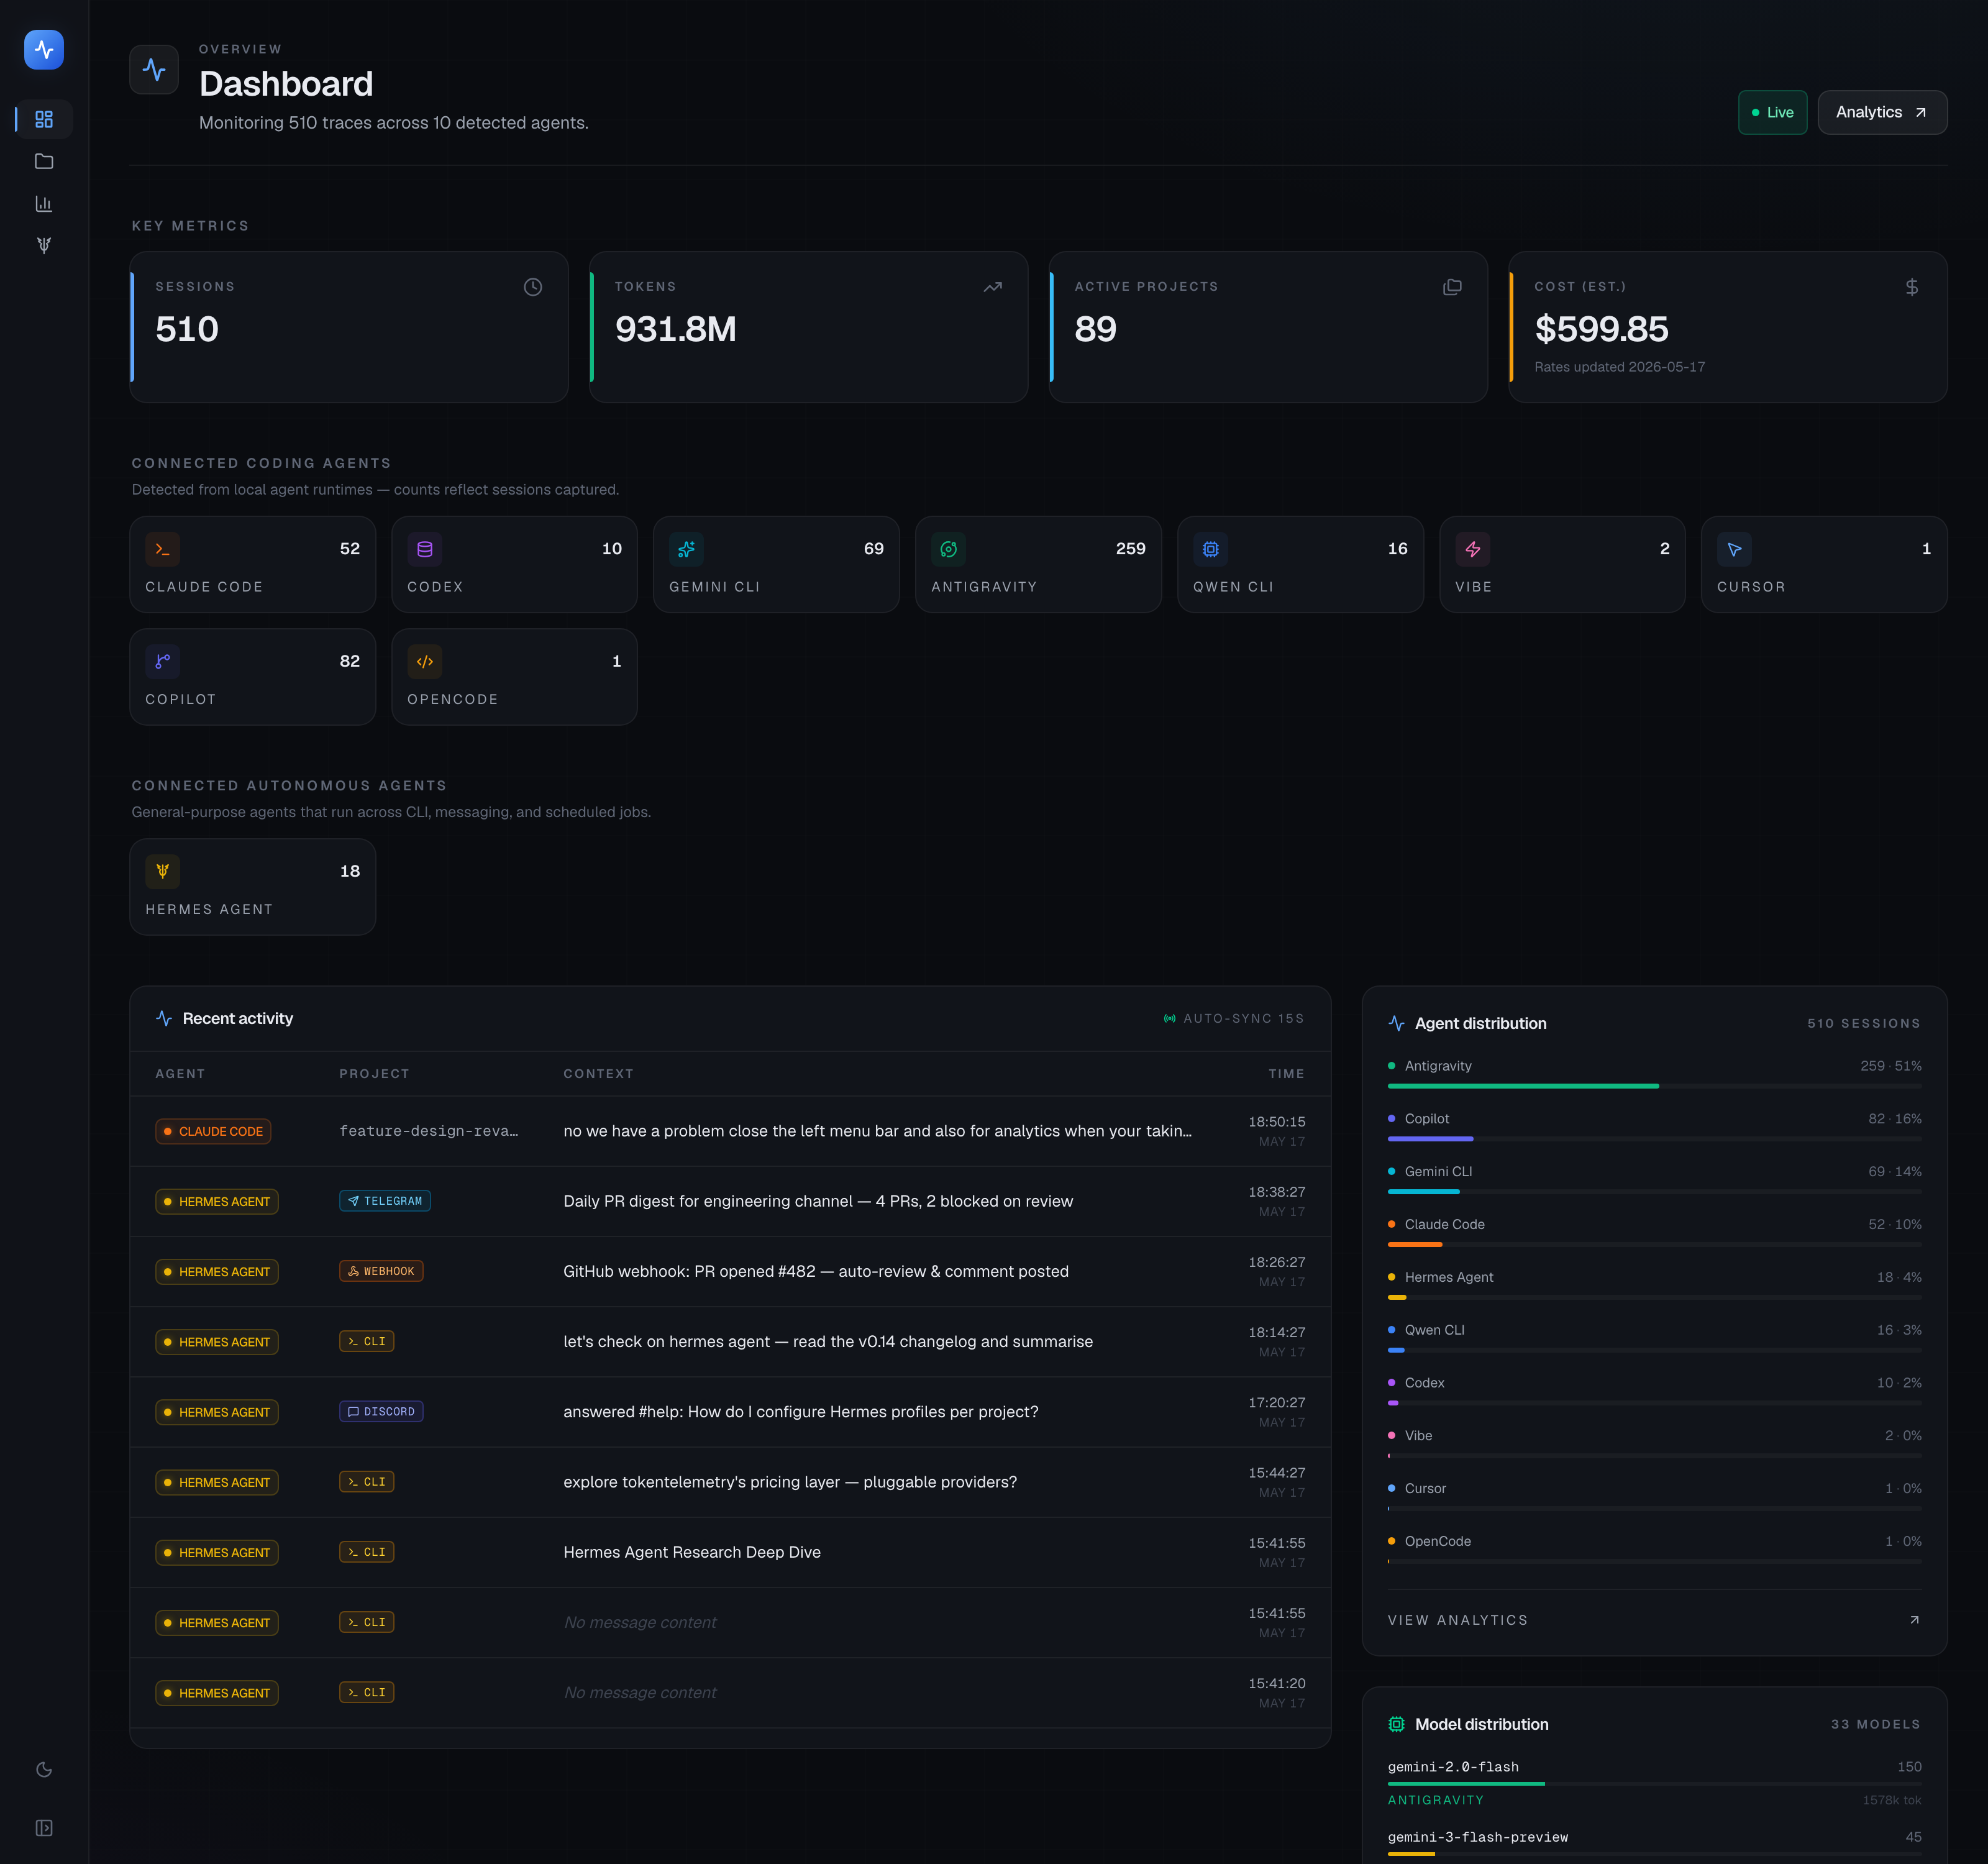
Tokens, cost, traces, and reasoning — for every agent, in one local dashboard.
What you'll see
One dashboard. Every agent.
Autonomous agent observability — a different class of agent, its own surface.
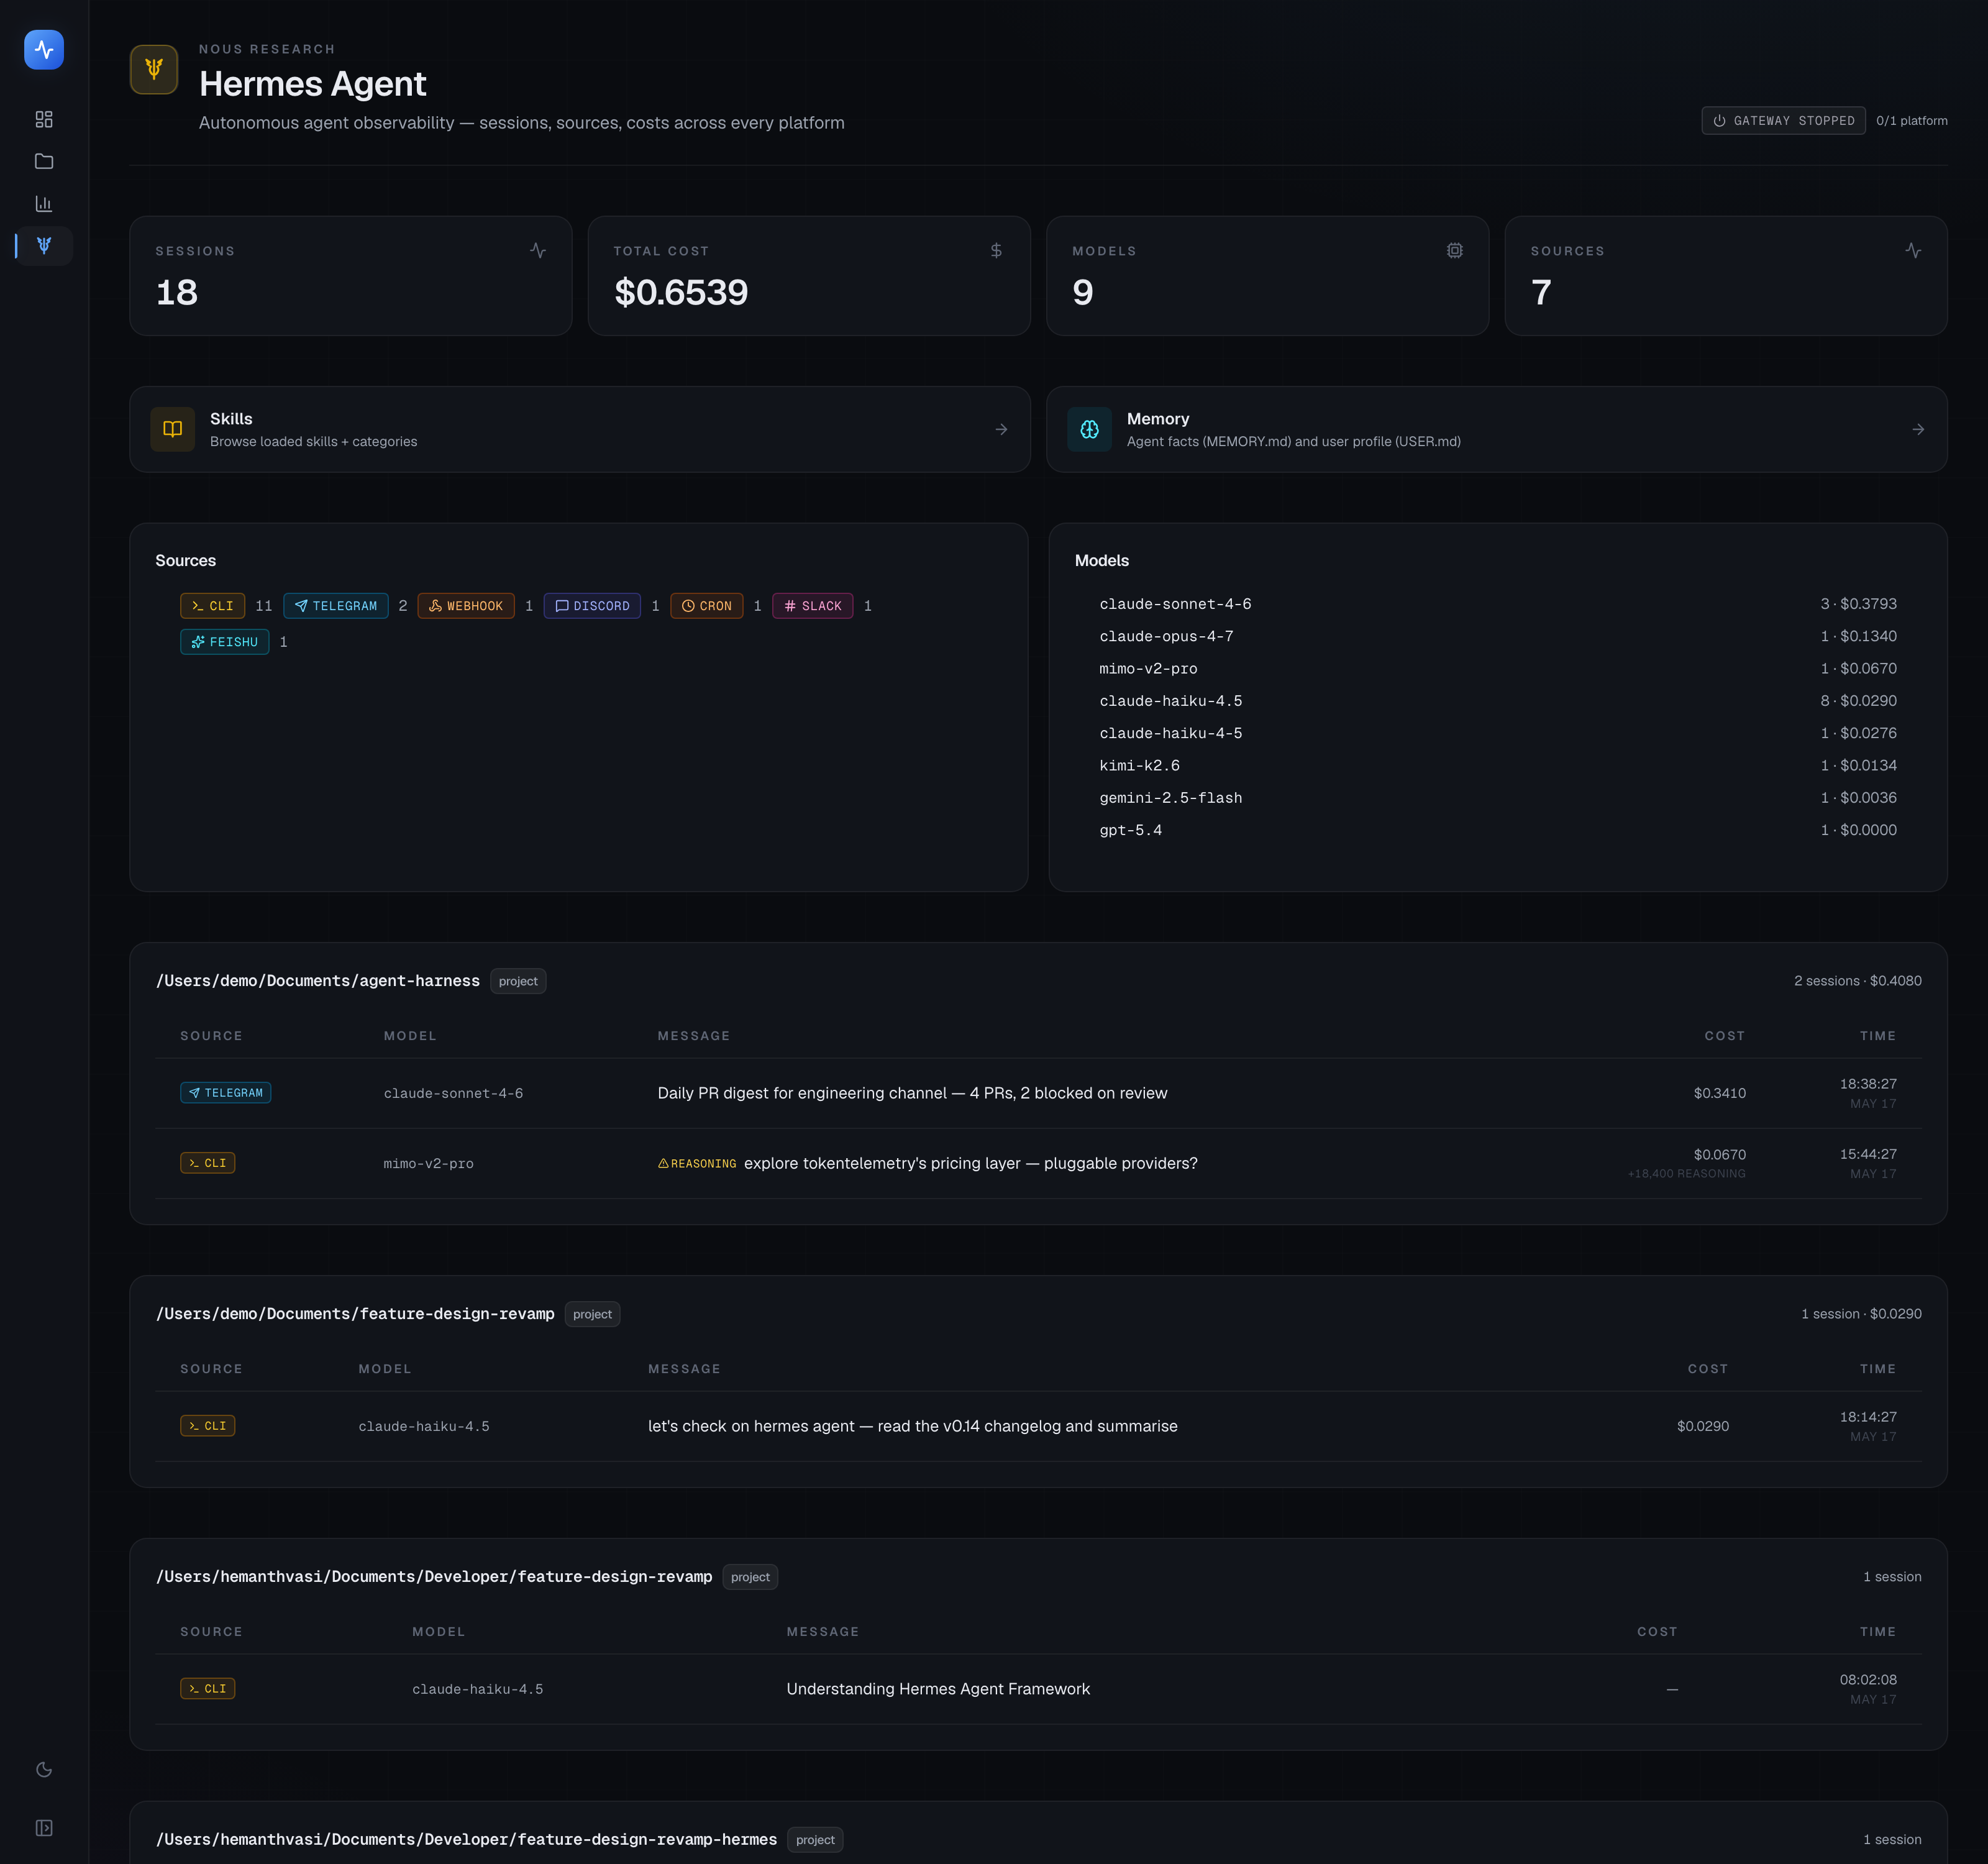
Dedicated /hermes dashboard: gateway health, scheduled-job status, source breakdown across 38 platforms (CLI / Telegram / Discord / Slack / Feishu / DingTalk / cron / webhook / …).
Per-API-call latency and cache-hit % parsed from agent.log — none of the other agents emit this.
Subagent delegation rendered inline: each delegate_task call expands to show the child's summary, tokens, duration, and tool trace.
Skills + memory pages: 90 loaded skills with platform conditions, MEMORY.md / USER.md with char-limit progress bars.
Cost anomaly detection: silent reasoning-token waste (MiMo thinking-mode) flagged automatically.
Hermes Dashboard plugin: one-command install adds a TokenTelemetry tab inside Hermes's own web UI (port 9119) — deep-link launcher to Overview, Skills, Memory, Analytics, Projects.
The only observability built for autonomous agents.
Hermes runs across CLI, Telegram, Discord, Slack, Feishu, DingTalk, cron, webhook — 38 source platforms in total. TokenTelemetry is the only tool that observes them as a single agent, with a dedicated dashboard that respects how Hermes actually works.
$curl -fsSL https://tokentelemetry.com/install.sh | bash
$hermes plugins install VasiHemanth/tokentelemetry-hermes-plugin$hermes dashboard
The plugin is a launcher, not the engine. It opens TokenTelemetry pages inside Hermes Dashboard — but only when TT itself is running. Skip step 1 if you already have TT on:3000.
Built for people who read the source
Your data stays on your machine.
No cloud, no accounts. Your logs, prompts, and costs never leave your computer — the only things that go out are anonymous, content-free usage stats (one-click off) and an optional update check. Read the policy.
Local & read-only
Reads session logs from your filesystem and serves a UI on localhost. Your logs, prompts, tokens, and costs never leave your computer. The app never writes to your agent files.
Anonymous usage stats
To know what to build next, the app sends anonymous, content-free stats (which pages/features you use — never your code, prompts, paths, or costs). On by default; see the exact payload and turn it off in Settings → Usage & privacy or with DO_NOT_TRACK=1.
MIT open source
Read every line. Fork it. Replace it with something better — up to you. 180 commits, public on GitHub, and the telemetry pipeline is in the source with an allowlist test.
Coverage
13 coding agents, one place.
Tap any agent to see what TokenTelemetry captures and where it reads from.
FAQ
Common questions
What is Token Telemetry?
+
Token Telemetry (also written TokenTelemetry, sometimes misspelled as 'token telementry' or 'tokentelementry') is a free, open-source, 100% local observability dashboard for AI coding agents like Claude Code, Codex, Gemini CLI, Cursor, and GitHub Copilot. It tracks tokens, cost, tool calls, and reasoning by reading the log files those agents already write — no SDK, no signup, no cloud.
How do I track Claude Code token usage?
+
Install TokenTelemetry, run Claude Code normally, and open http://localhost:3000. TokenTelemetry auto-detects Claude Code sessions from ~/.claude/ logs — no instrumentation, no SDK, no config.
How do I monitor Google Antigravity, Codex, and Gemini CLI costs?
+
TokenTelemetry auto-reads logs from Google Antigravity (Google's agentic coding CLI), OpenAI Codex CLI, Gemini CLI, Cursor, GitHub Copilot, Qwen CLI, OpenCode, Vibe, Grok Build (xAI), Cline, SmallCode, and Pi (Earendil Works). Token counts and dollar costs appear in the local dashboard automatically.
Is there a free tool to monitor AI coding agent token usage?
+
Yes — TokenTelemetry is free, open-source (MIT), and runs 100% locally. No account, no signup, no cloud.
Does TokenTelemetry send my data to the cloud?
+
Your logs, sessions, prompts, tokens, and costs never leave your computer — the dashboard reads local files and serves a UI on localhost. The app does send anonymous, content-free usage stats (which pages and features you use — never your code, prompts, paths, or costs) so we know what to improve; it's on by default and you can see the exact payload and turn it off in Settings → Usage & privacy, or with DO_NOT_TRACK=1. There's also an optional GitHub update check (no usage data); disable with TT_NO_UPDATE_CHECK=1.
How does TokenTelemetry compare to Langfuse or Helicone?
+
TokenTelemetry is purpose-built for AI coding agents and is zero-config — no SDK instrumentation. Langfuse and Helicone are general LLM-app observability platforms that require code changes and (typically) a cloud account.
Which agents does it support?
+
Thirteen coding agents (Claude Code, OpenAI Codex, Gemini CLI, Cursor, GitHub Copilot, Qwen CLI, OpenCode, Vibe, Antigravity, Grok Build, Cline, SmallCode, Pi) plus Hermes Agent — Nous Research's autonomous agent, which gets its own dedicated dashboard at /hermes with gateway health, scheduled-job monitoring, skills + memory observability, and 38 source platforms (CLI / Telegram / Discord / Feishu / DingTalk / cron / webhook / …).
Why does Hermes Agent get its own page?
+
Hermes is structurally different from coding agents — it runs across messaging platforms (Telegram / Discord / Slack / WhatsApp / Signal / Matrix / Feishu / DingTalk / WeChat), supports persistent skills and memory, delegates to subagents, and runs scheduled cron jobs. Forcing it into the same UI as Claude Code would hide most of what it does, so it gets a dedicated surface that respects its shape.
Can I use TokenTelemetry from inside Hermes Dashboard?
+
Yes — there's a Hermes Dashboard plugin that registers a 'TokenTelemetry' tab inside Hermes's web UI at port 9119. It's a thin launcher: deep-link cards open the relevant TokenTelemetry page (Hermes Overview, Skills, Memory, Analytics, Projects) in a new browser tab, so you don't have to remember a second port. Install with `./scripts/install-hermes-plugin.sh` from the TokenTelemetry repo, then run `hermes dashboard`.
Stop guessing what your agents cost.
Free, open source, 100% local. One command and you're looking at the numbers.
$curl -fsSL https://raw.githubusercontent.com/VasiHemanth/tokentelemetry/main/install.sh | bash