Dashboard
A bird's-eye view of your entire agent fleet — live KPI strip, agent distribution, model leaderboard, and recent activity.
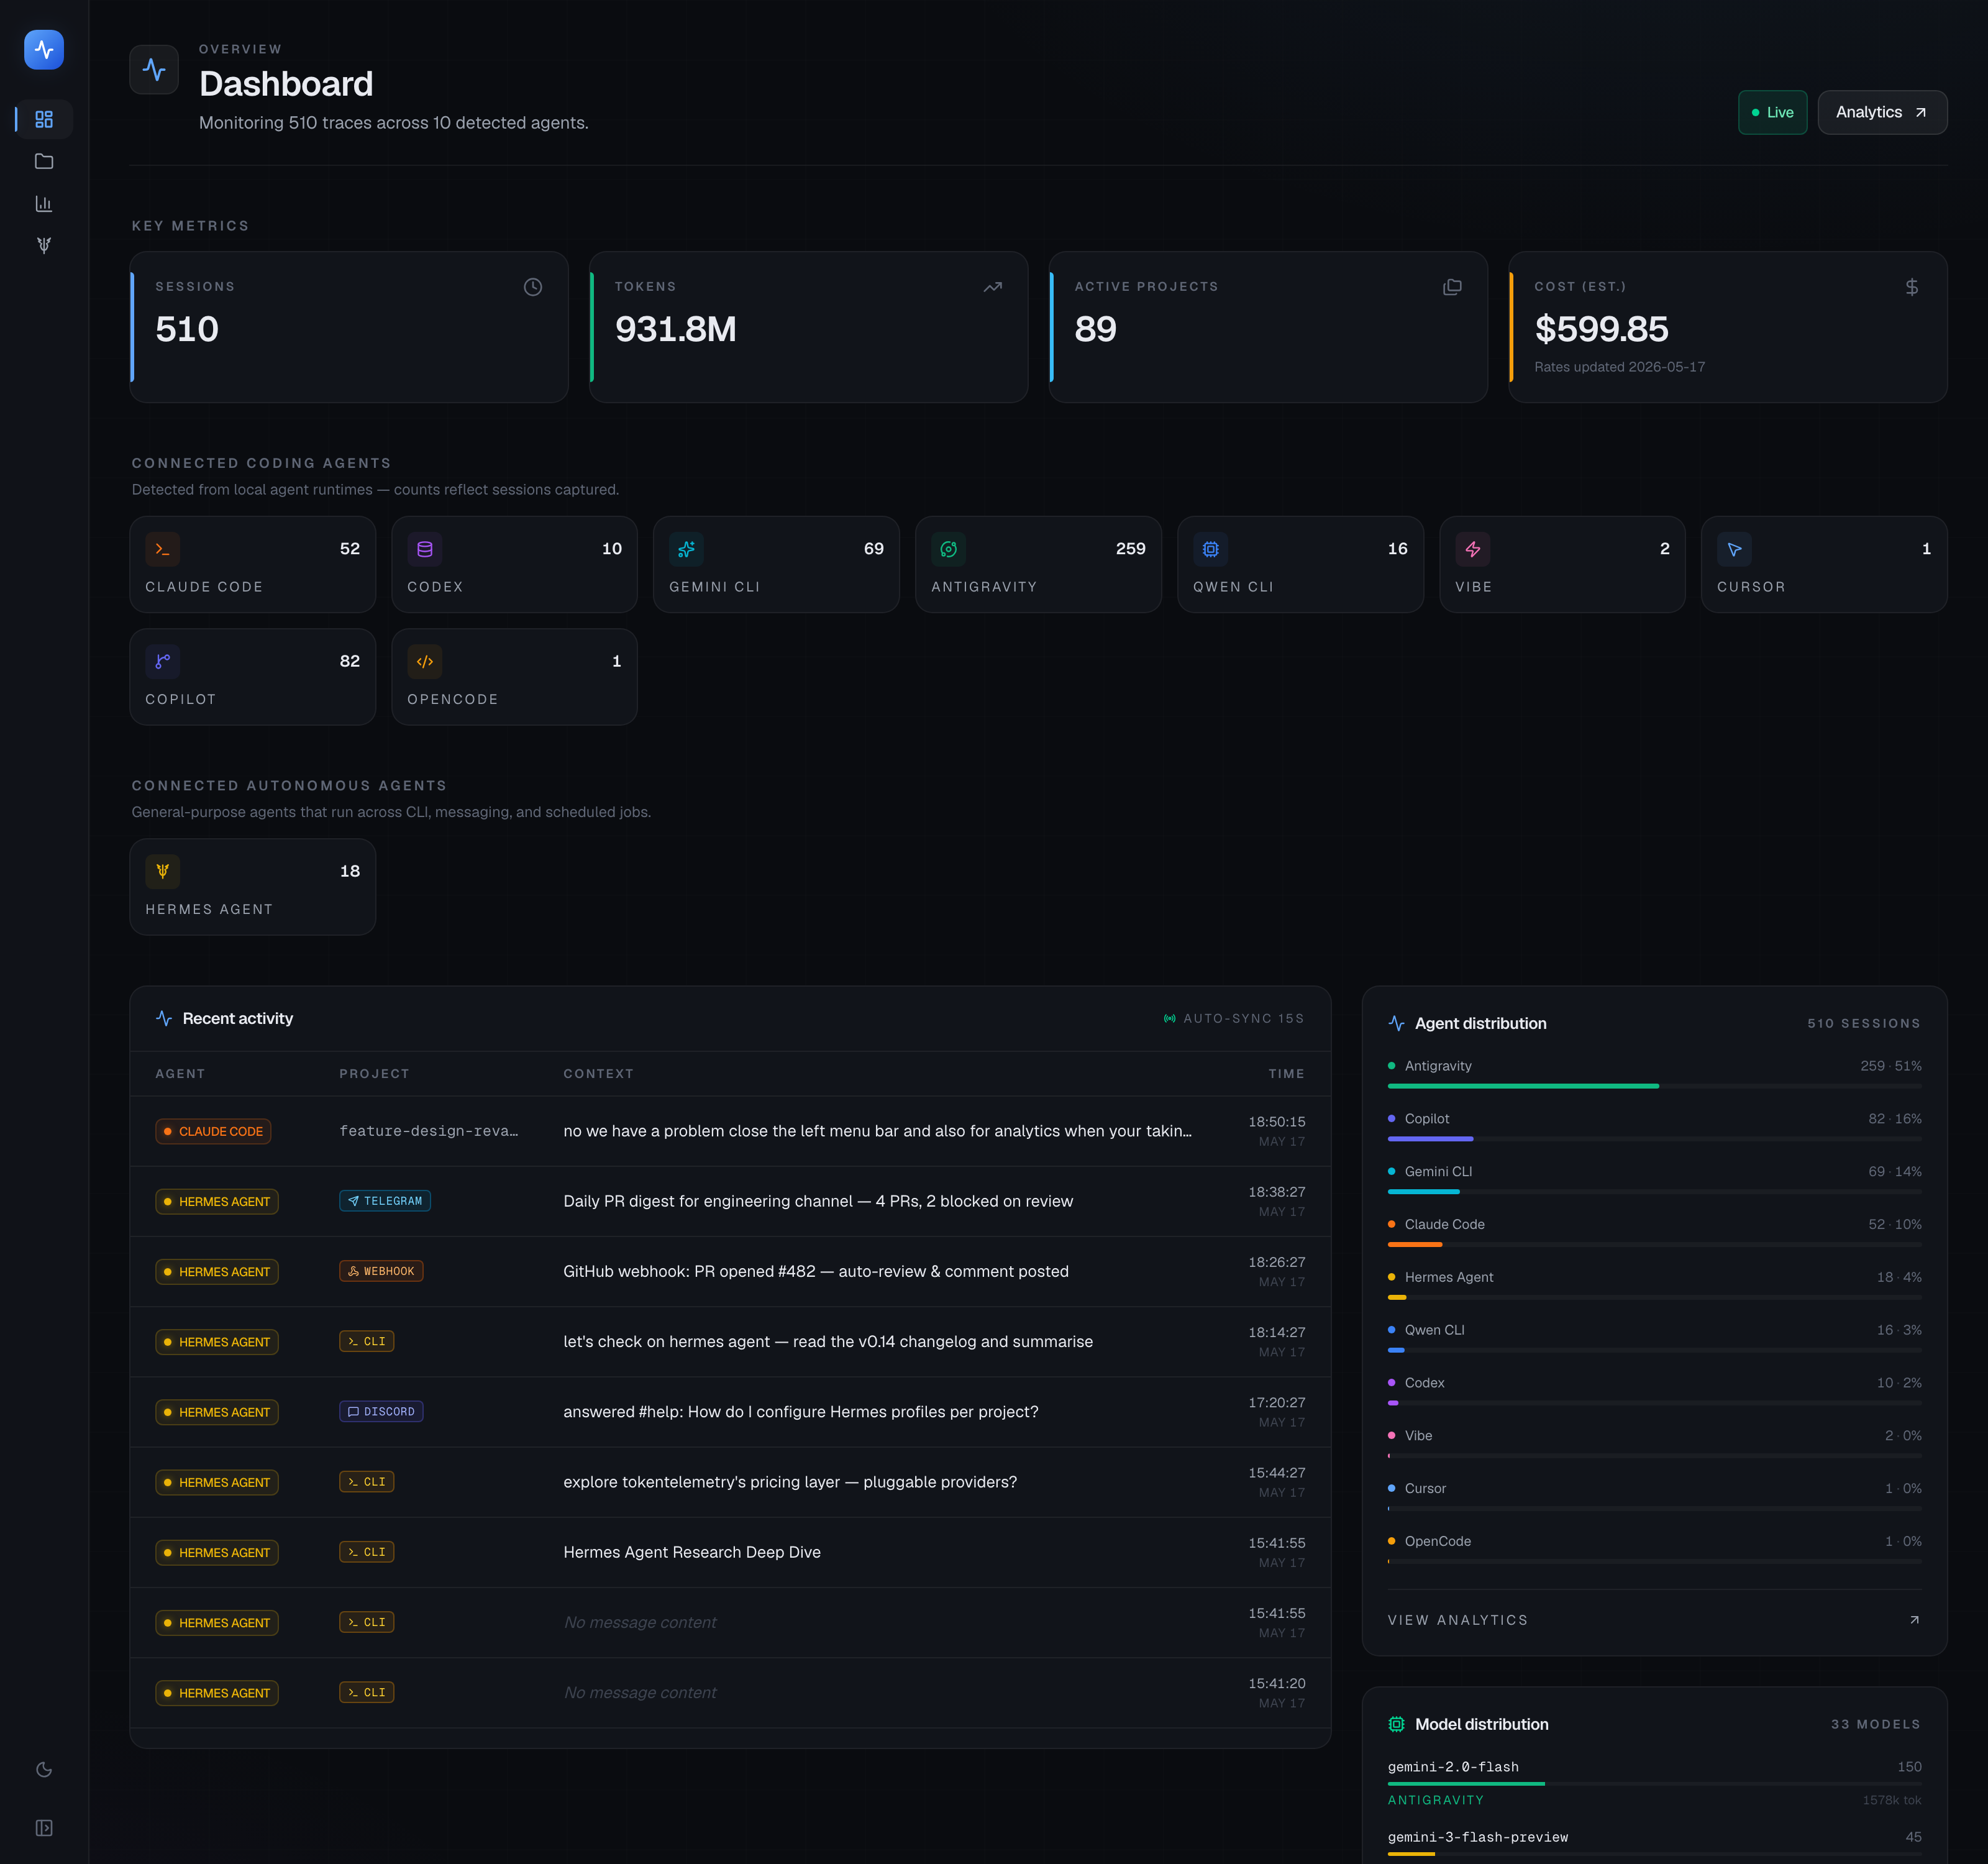
The Dashboard is the first page you see when you open TokenTelemetry. It gives you a real-time overview of all activity across every detected agent and model.
Video walkthrough
KPI strip
At the top of the dashboard are four KPI cards updated on every refresh:
| Card | What it shows |
|---|---|
| Sessions | Total number of agent sessions ever recorded |
| Tokens | Cumulative input + output tokens across all sessions |
| Projects | Number of distinct working directories |
| API-equivalent cost | Dollar estimate based on current model pricing |
Live 15-second sync
The dashboard polls the backend every 15 seconds. If an agent is actively running you'll see token counts increment in near-real-time without a manual refresh.
Coding vs autonomous agent split
A split view below the KPI strip shows how your usage breaks down between coding agents (Claude Code, Codex, Gemini CLI, etc.) and autonomous agents (Hermes Agent). This makes it easy to see at a glance how much of your token budget is coming from interactive sessions vs automated workflows.
Agent panels
Every agent stores things on your disk that a session transcript doesn't show: Codex keeps cron schedules, Claude Code keeps a fleet of background jobs, Copilot records what each request actually cost in its own billing units. Click an agent tile to open a page built from that harness's own files.
A tile shows how many panels sit behind it. Agents that keep nothing beyond their transcripts stay quiet rather than opening an empty page.
Hermes Agent works the same way as the rest, but its page is deliberately narrow: it carries only what the dedicated /hermes pages don't already show, and puts a button at the top that takes you to them.
| Agent | What its page shows |
|---|---|
| Codex | Scheduled automations (cron and hourly heartbeat, with the schedule in plain English), approval policy and sandbox mode, its thread registry, and the parent→child delegation graph |
| Claude Code | 5-hour and 7-day subscription usage, background jobs with the pull requests they produced, phased multi-agent workflow runs, edit checkpoints, and which skills and plugins you actually use |
| Copilot | Premium request usage in AIU, plus per-request token classes, time to first token and generation rate |
| Grok Build | Weekly credit usage and subscription tier, plugin jobs launched from Claude Code, trusted folders and installed skills |
| Antigravity | Its conversation index, competing agent runs and which one won, plan and walkthrough artifacts, and the code tracker's pre-edit snapshots |
| Cursor | How much of each commit was written by tab-completion, by composer, and by you |
| Gemini CLI | Trusted folders, MCP servers, extensions, and the map from its hashed project directories back to real repositories |
| OpenCode | Its todo board, projects and sandbox config, per-session diffs and the snapshot store |
| Qwen CLI | Todos per session, the auto-approved command list, and any editor currently attached |
| Cline | Exit code per run — few agents record whether a run actually succeeded — plus providers and team runs |
| Vibe | Whether its API key still works, and the agreed/rejected/failed split of its tool calls |
| Muse Code | Its session index: provider, model, branch, prompt count and status |
| Prime Agent | The Python variables its kernel keeps alive between turns, and its daemon workers |
| Pi | MCP servers, trusted directories and model configuration |
| DeepSeek Harness | Sandbox profiles, the workspace registry with real titles, and the default model |
| Qoder | Credits spent, and how much of that went to subagents — Qoder records no token counts, so credits are the only spend it reports. Plus its sessions, installed plugins, and what stays encrypted |
| ZCode | Reasoning-level latency, tool safety labels (read-only / destructive), and the permission posture in force per project |
| Kimi Code | The per-turn loop limits it enforces (max steps, max retries) and its own work-directory registry, showing which project each directory ran and the last session there |
| SmallCode | Traces, when TT_SMALLCODE_ROOTS points at the repositories holding them |
| Hermes Agent | Its own billing record per provider and model — what Hermes says it was charged, not a price-list estimate — plus the processes it has registered. A button opens the full Hermes dashboard. |
Each panel names the file it came from, so any number can be checked against the source.
Read-only, and no credentials
Panels never write to an agent's directory, and never read the contents of a credential file — only whether one exists. Bulk content stays out too: file snapshots, captured page DOM and voice transcripts are reported as counts and timestamps, never quoted. Databases are opened read-only, so a panel is safe to view while the agent is running.
Where an agent has a capability TokenTelemetry can't show, the page says so and why, rather than leaving a silent gap. Claude Code's Routines are scheduled in the cloud, for example, so there is no local schedule to list. A store that exists but is empty is labelled as empty, which is different from absent.
Agent and model distribution
Two distribution charts show:
- Agent distribution — which agents you've used (Claude Code, Codex, Gemini CLI, etc.) and their share of total tokens.
- Model distribution — which LLMs (claude-sonnet-4-6, gemini-2.0-flash, etc.) are doing the most work.
Both charts are updated live.
Recent activity feed
A chronological feed of the most recent sessions across all agents. Each entry shows:
- Agent name and model
- Project directory
- Token count and cost for the session
- Relative timestamp ("3 minutes ago")
Click any entry to open the full session trace.
Local power toggle
If you have local models configured (Ollama, llama.cpp, etc.) a Local power toggle appears on the dashboard. Enabling it shows a power and CO₂ panel alongside the cost numbers. See Local Models & Power Cost for setup.
Tips
- The KPI numbers are cumulative across your full history. Use Analytics to filter by date range.
- The agent distribution chart only shows agents with at least one session. Newly-installed agents appear after their first session completes.
- If the token count seems wrong for a session, open the trace and check the "token/cost header" at the top — it shows the exact numbers the session log reported.