Analytics
Token trends by agent, model, and day — with date-range filters, cache efficiency metrics, and delegation graphs.
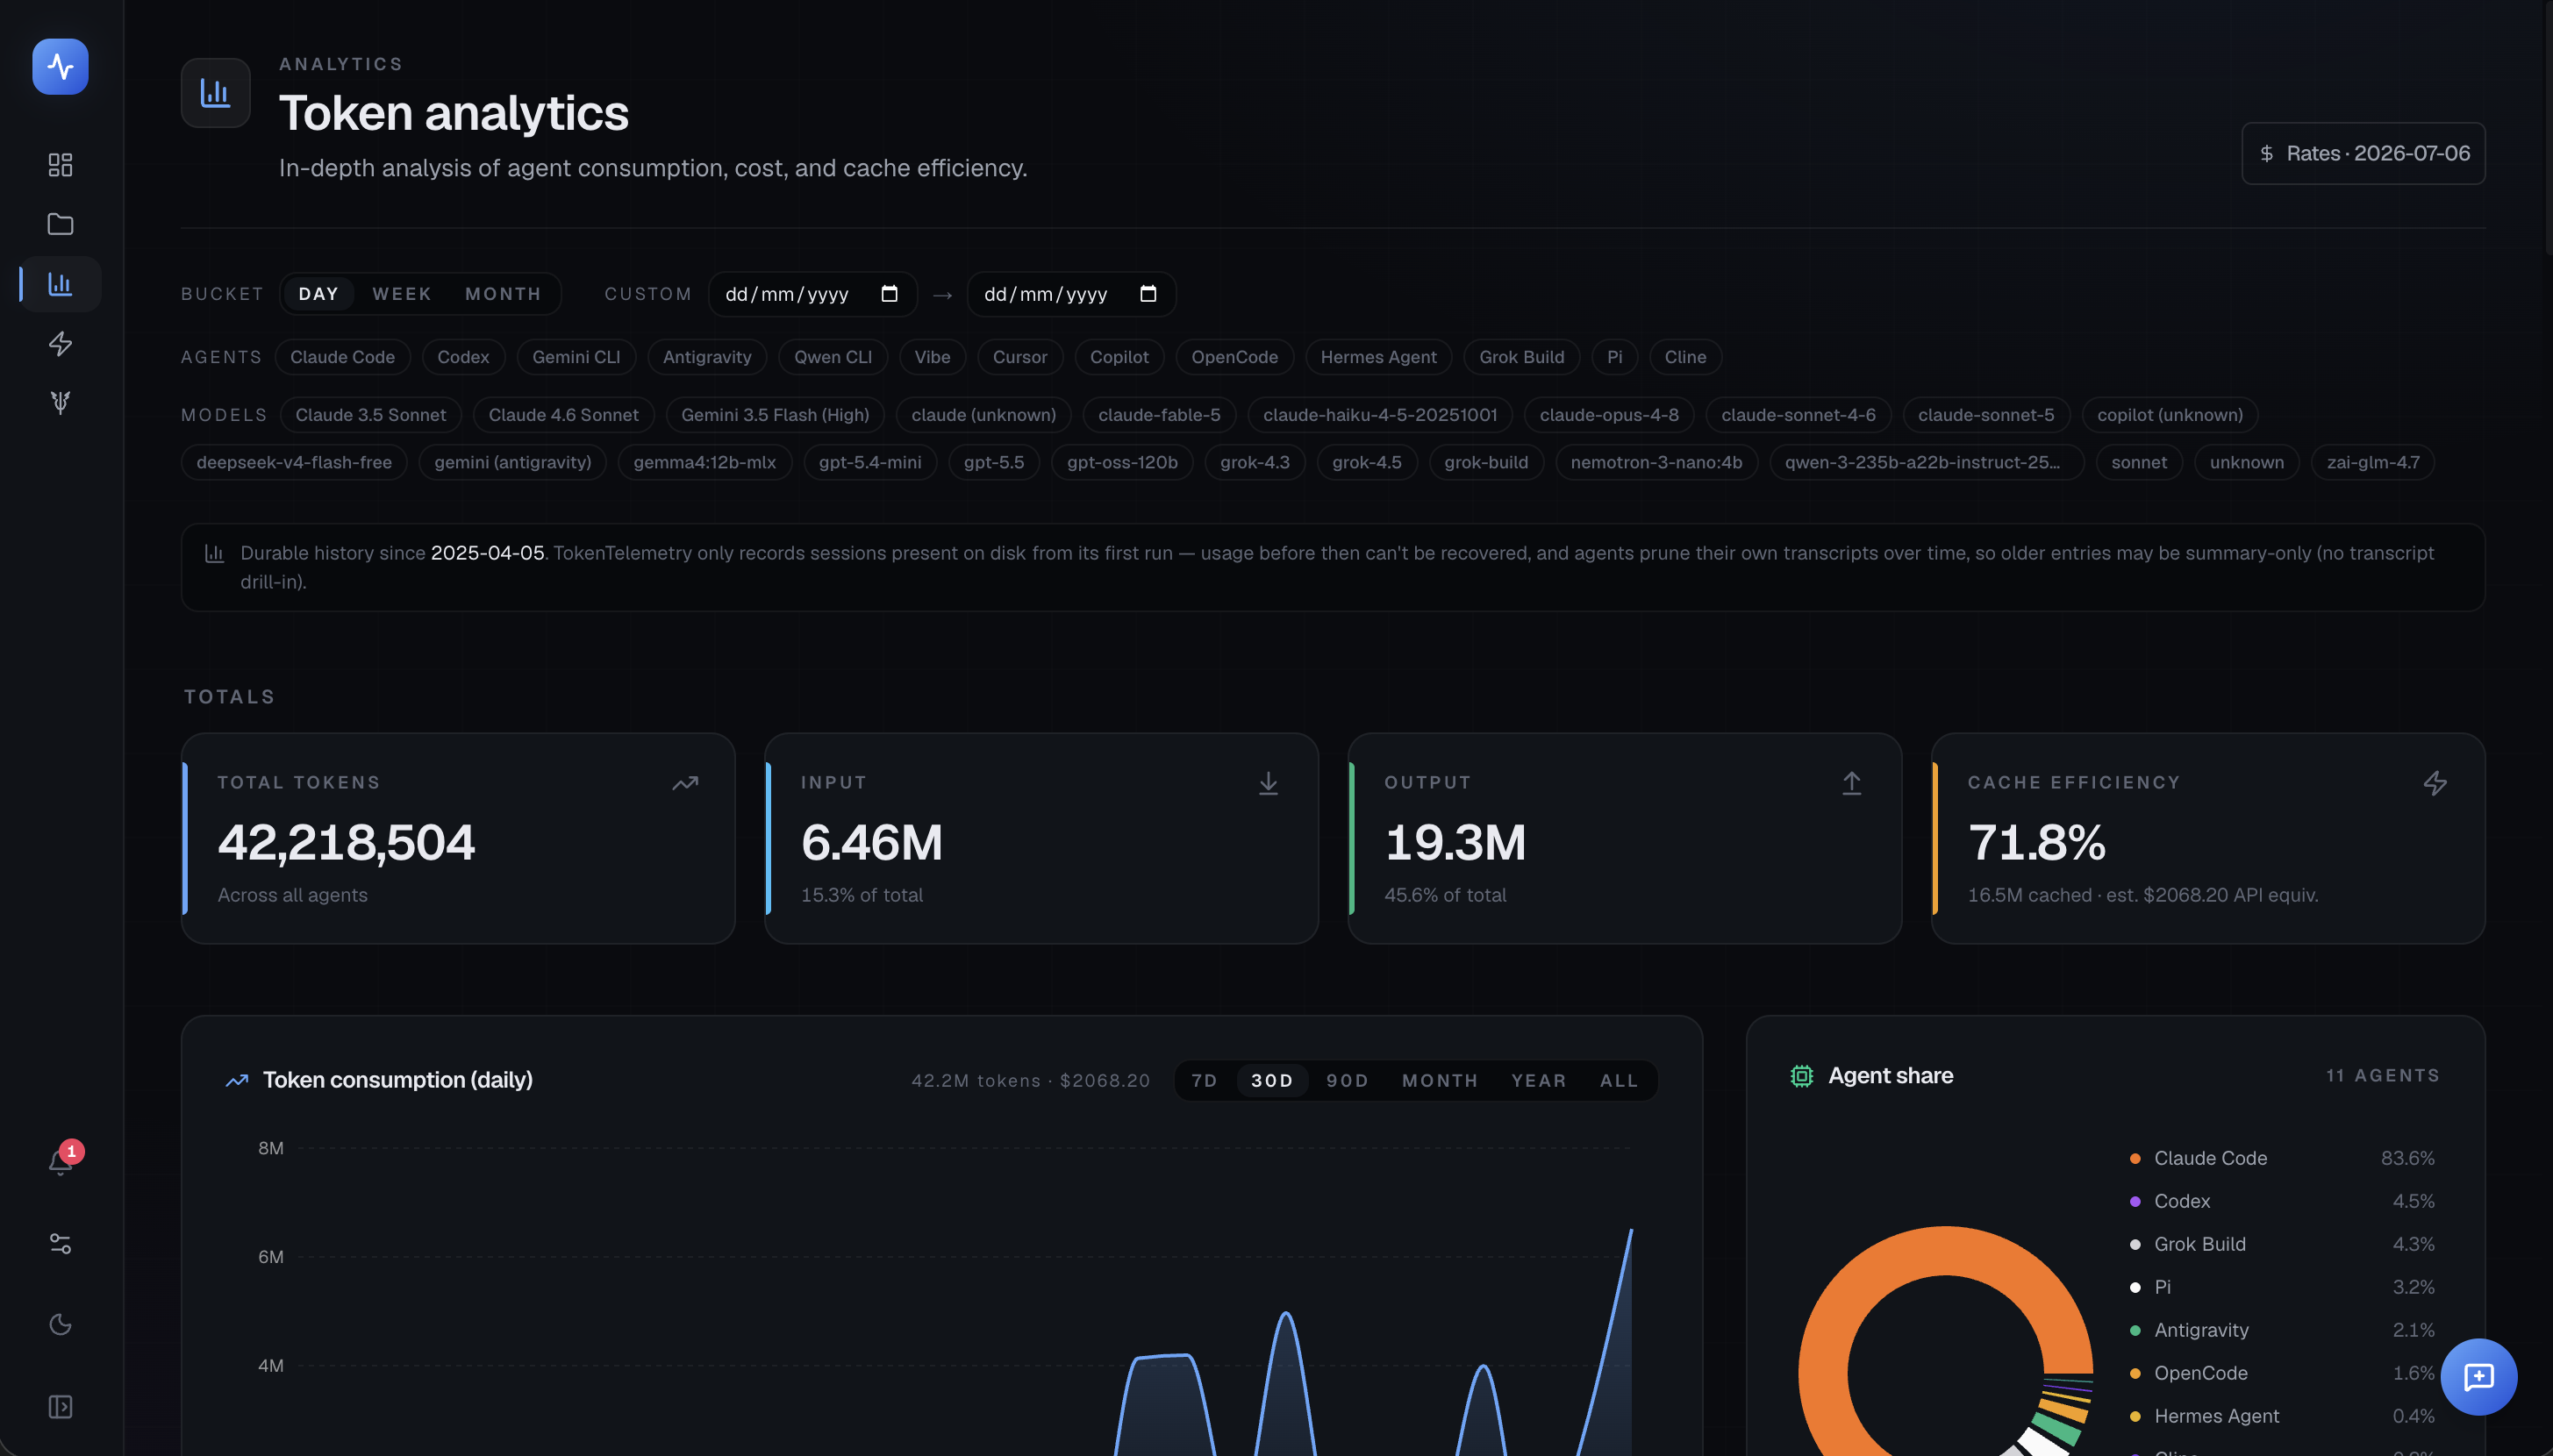
The Analytics page lets you explore token and cost trends over time, filtered by agent, model, and date range. All computation runs locally — no data ever leaves your machine.
Video walkthrough
Date presets and custom range
Quick presets sit on the consumption-chart header:
- 7d, 30d, 90d — the last N days
- Month — the current calendar month to date
- Year — the current year to date
- All — every session on record
- Custom — a start/end date picker in the filter toolbar
The selected range applies to every chart and table on the page.
Bucket (granularity)
The Bucket toggle sets how the charts group time: day, week, or month. The consumption chart's title tracks it ("Token consumption (daily)", "(weekly)", "(monthly)"). Finer buckets show which specific day had an expensive session; coarser buckets smooth out noise for monthly budget reviews.
Agent and model filters
Two labeled rows of pill toggles, Agents and Models, narrow the view. Click a pill to include or drop that agent or model; clear resets that row to all. The Models row appears once more than one model has been seen, and it accumulates across the windows you view, so switching ranges doesn't drop a model you'd already selected.
Totals
A row of four tiles summarizes the selected window:
- Total tokens across all agents
- Input tokens, with their share of the total
- Output tokens, with their share of the total
- Cache efficiency — cached tokens as a percentage of input plus cached, with the cached-token count and estimated API-equivalent cost beneath it
Token consumption chart
A single area chart plots total tokens per bucket (day, week, or month) across the selected range; its header shows the range totals as a "tokens · cost" summary. Narrow which sessions feed it with the agent and model filters. There is no separate stacking or grouping control — the line is always the combined total for whatever is currently filtered in.
Agent and model share
Beside the daily chart, an Agent share donut splits total tokens by agent, with a legend giving each agent's percentage. The per-model section adds two more views: a Tokens per model horizontal bar chart (one bar per model, colored by the owning agent) and a Model share donut. Together they show your agent and model mix at a glance, before you read the detail tables below.
Per-agent table
A table shows each agent's totals for the selected period:
| Column | Description |
|---|---|
| Agent | Agent name |
| Sessions | Number of sessions |
| Input | Total input tokens |
| Output | Total output tokens |
| Cached | Tokens served from cache |
| Total | Input + output + cached |
| API equiv. | API-equivalent cost |
Per-model table
A matching table groups the same data by model rather than agent — useful for comparing a model you use across several agents (e.g. the same Claude model invoked by both Claude Code and Codex). Row-click filtering by model is planned but not yet wired up.
Delegation & ecosystem
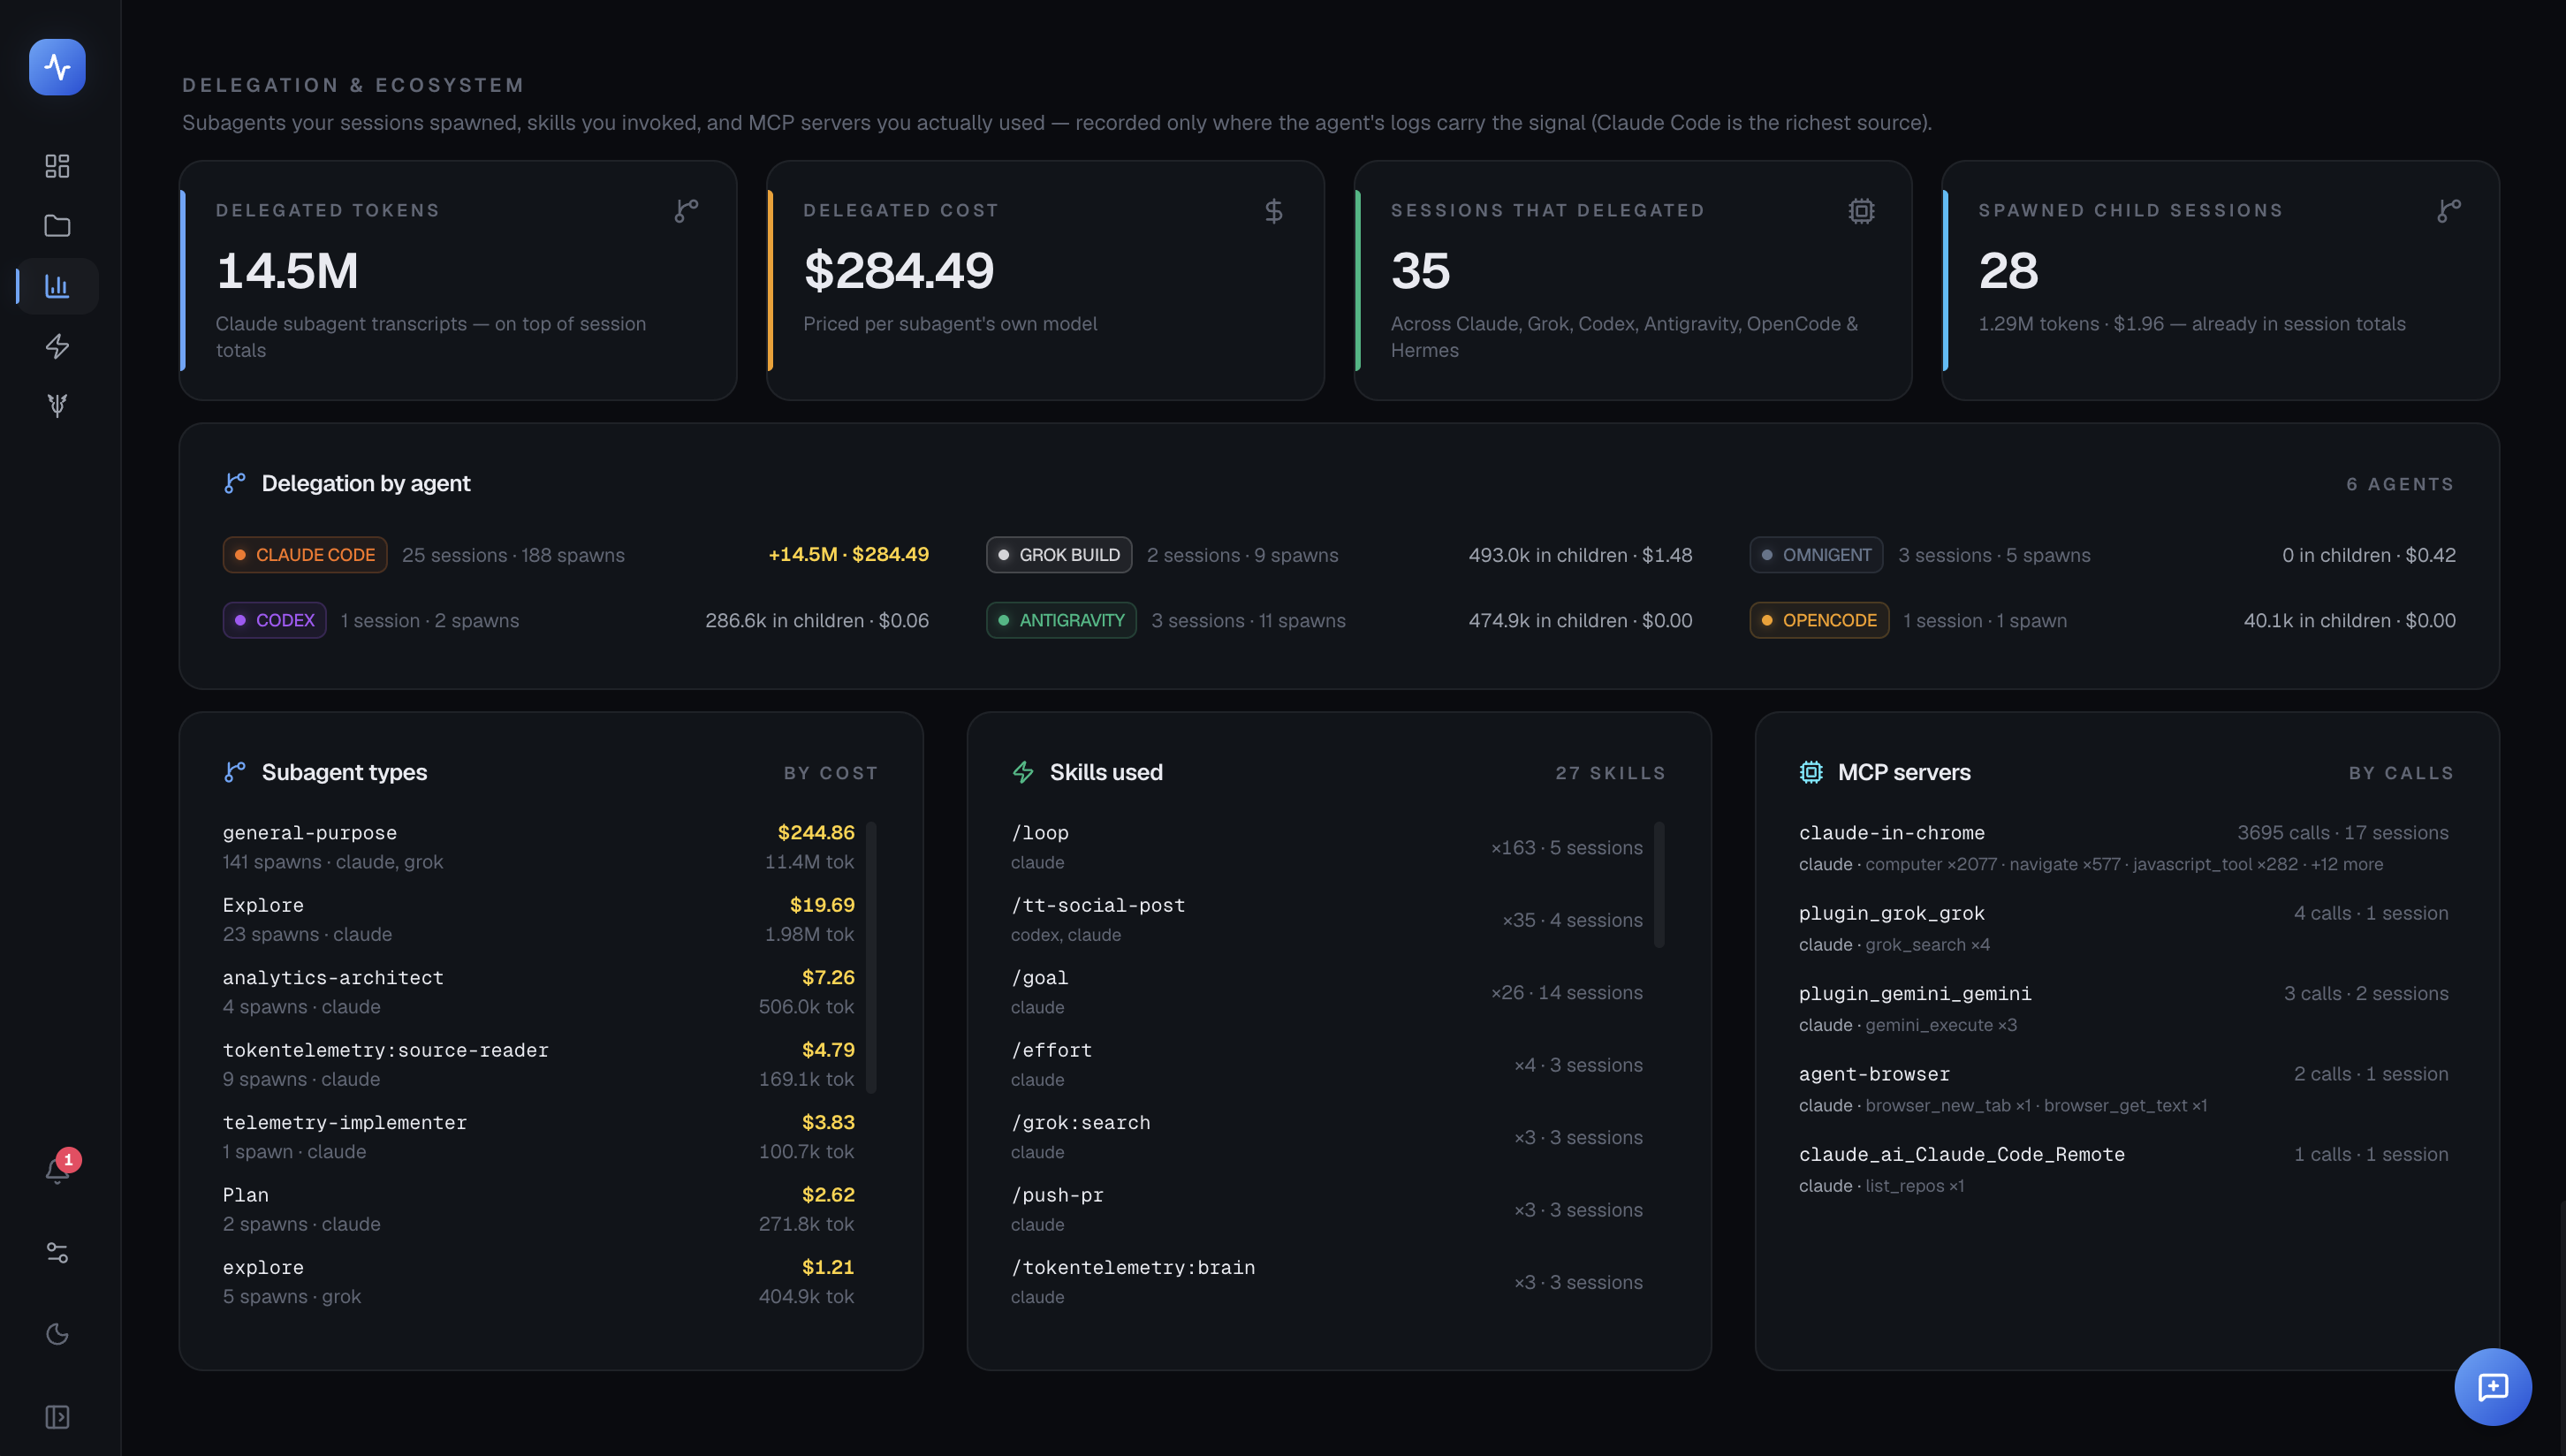
This section shows how your usage extends beyond direct interactions. It appears only when your logs carry delegation, skill, or MCP signal (Claude Code is the richest source).
Delegation totals
When any session spawned sub-agents, four tiles summarize it:
- Delegated tokens and Delegated cost — spend from Claude sub-agent transcripts. It's counted on top of the session totals, because those sub-agents aren't sessions anywhere else.
- Sessions that delegated — how many parent sessions farmed out work.
- Spawned child sessions — child sessions whose tokens are already inside the session totals; shown here only for attribution, not added again.
Delegation by agent
A card ranks agents by their combined delegated + child cost, listing each agent's parent sessions, spawns, and either the added delegated tokens (shown as +N · $cost) or the tokens already counted inside its children (shown as "N in children · $cost"). Agents whose logs don't record child tokens show "tokens n/a" rather than a misleading zero.
Ecosystem
| Card | Shows |
|---|---|
| Subagent types | Each sub-agent type ranked by cost, with spawn count, contributing agents, and tokens ("tokens n/a" when the agent doesn't record per-subagent tokens) |
| Skills used | Each skill (/name) with total invocations, session count, and which agents invoked it |
| MCP servers | Each server ranked by call count, with session count, its top three tools by call volume ("+N more" beyond three), and contributing agents |
Pricing and refresh
The header carries a Rates badge with the date the built-in price table was last updated; every dollar figure on the page is an API-equivalent estimate from that table. The page re-fetches every 30 seconds, so a session that's still running shows up without a manual reload.
Data availability
Analytics data depends on durable history being enabled. If you recently installed TokenTelemetry or recently enabled the Durable history option in History & Retention, earlier dates won't be available — only sessions captured after durable history was turned on appear. Older entries may also be summary-only: agents prune their own transcripts over time, so those rows still count toward totals but have no transcript to drill into. Usage from before TokenTelemetry's first run can't be recovered.
Tips
- Use the per-model table and Model share when deciding whether to switch models — they show directly whether one model is cheaper per session than another for your workload.
- The Cache efficiency tile is most useful when costs look higher than expected — a low percentage on Claude Code often means the prompt cache isn't warming up (e.g. the system prompt changing between sessions).
- High delegation spend isn't necessarily bad — it means your parent agent is successfully farming out subtasks, which is often more efficient than doing everything in one context.